
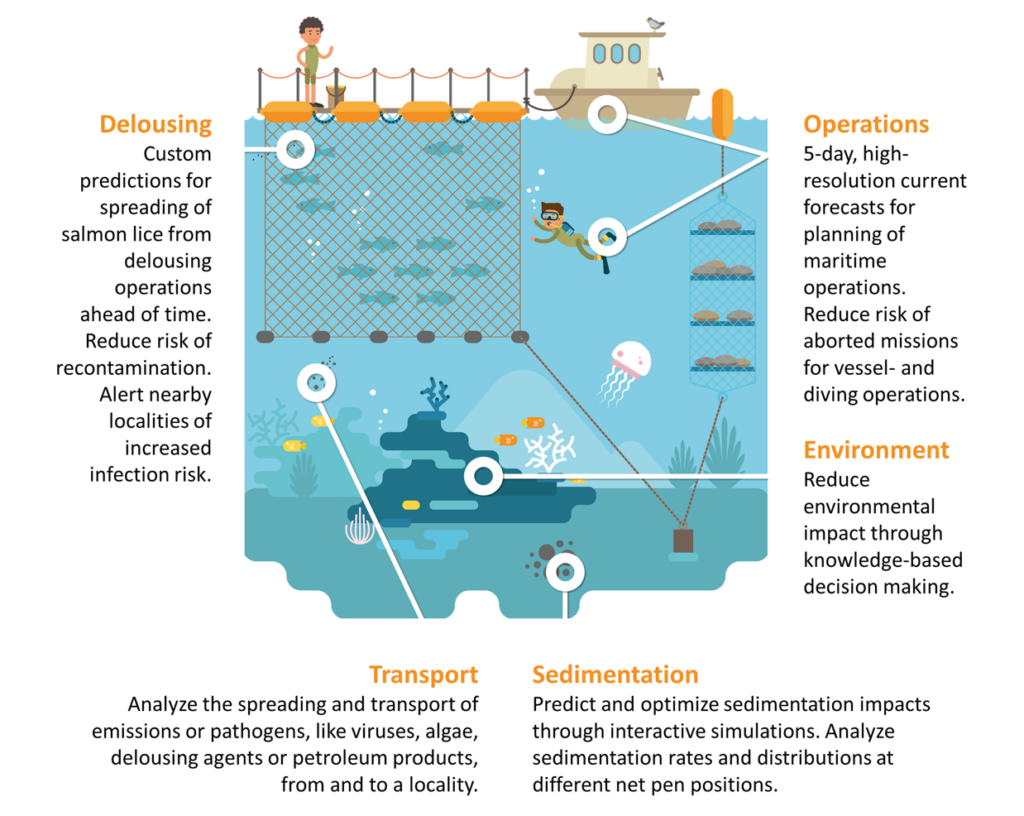
Oceanbox.io provides a range of ocean intelligence services for near shore operations. We aim to increase knowledge about ocean conditions and reduce risk on equipment, personnel, and the environment during operations under difficult or costly conditions.
We provide high-resolution, near-shore operational forecasts of currents, temperature and salinity 3-5 days ahead of time. The forecasts are run daily, using a state-of-the-art finite-volume oceanography model. We also provide interactive models for the spreading of salmon lice, delousing agents, pollutants, plumes, and sedimentation.
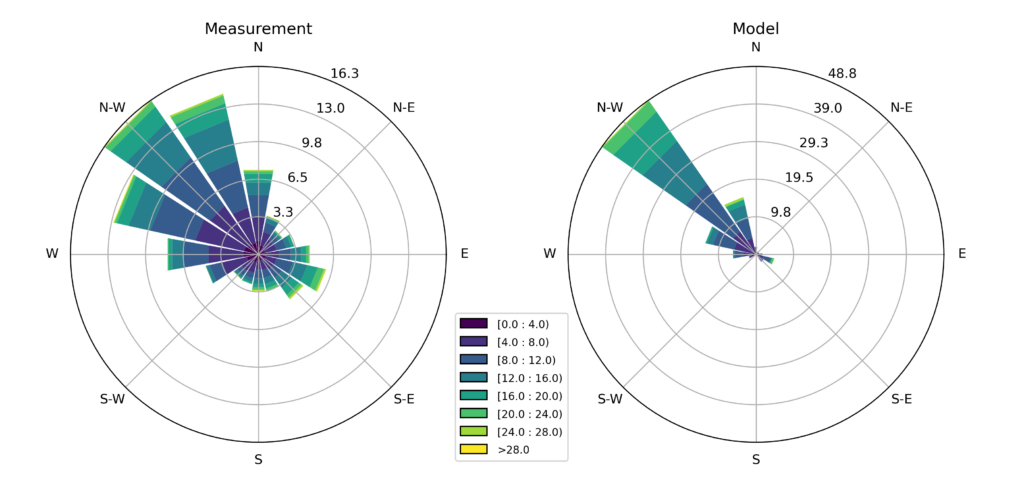
Model validation
We are constantly validating the model against observations and instruments measuring currents along the coast. Check out our model validation page for more details
The dashboard
The oceanbox.io services are delivered through a user-friendly online interactive dashboard. As well as giving customers the possibility to analyze pre-calculated archived data you can also perform your own analysis by accessing our supercomputer and do your own simulations in areas of interest.
Example: Frøya aquacultural sites
Map options
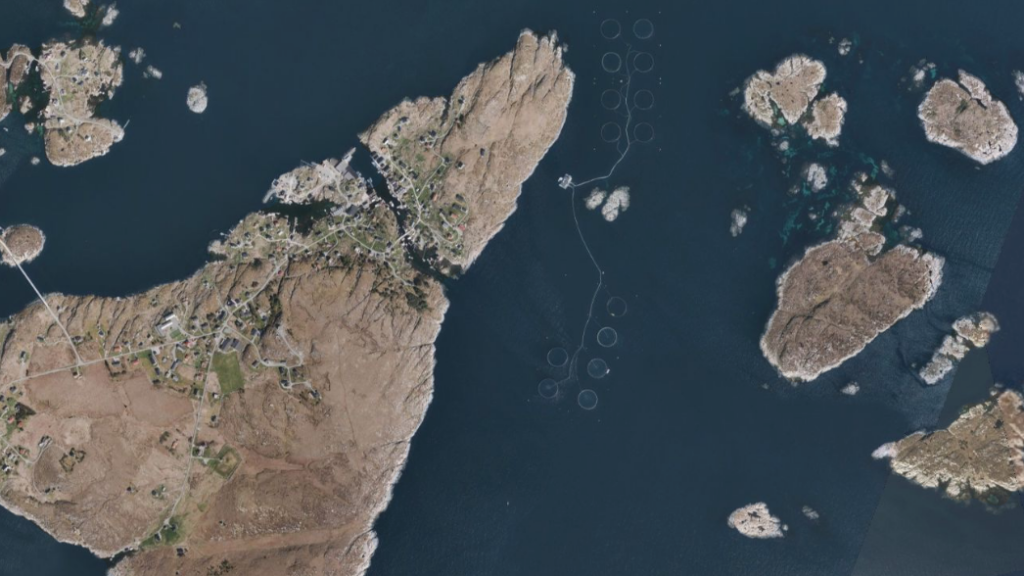
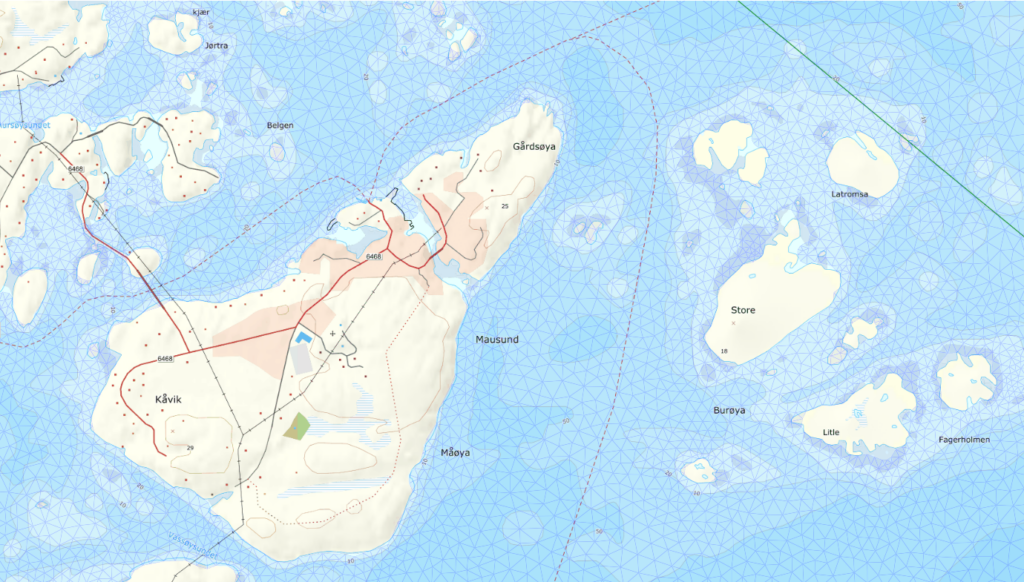
This picture is a capture from the map section of the dashboard showing a satellite image from the Frøya area in Norway containing two aquacultural sites. Surrounding the sites are several small and big islands.
High resolution grid
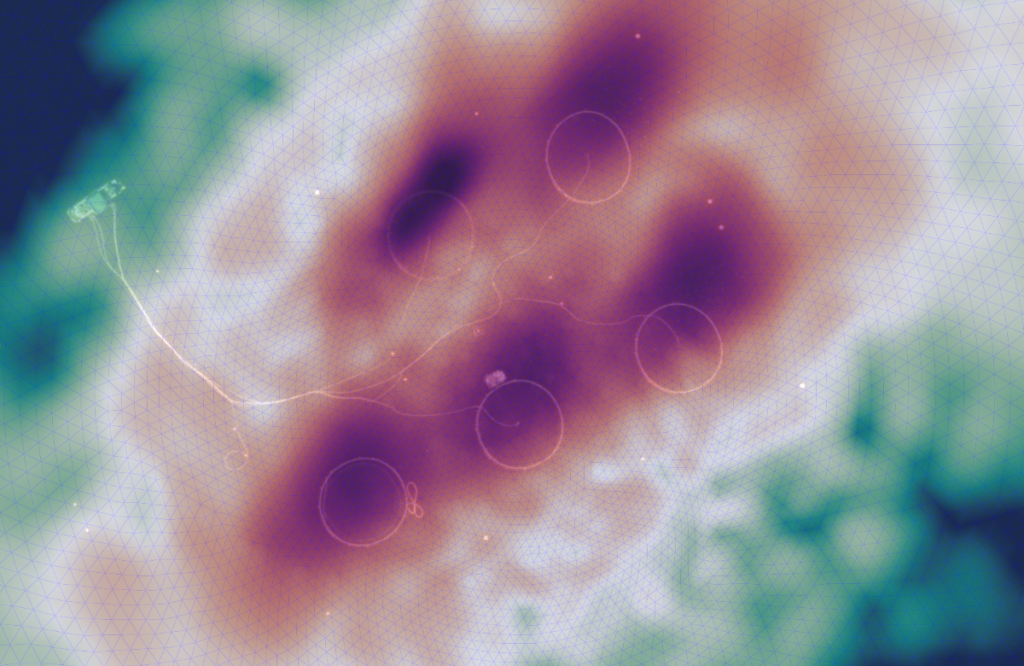
This capture from the dashboard shows the grid layer. The dynamic high resolution of the grid is important to ensure correct simulation of the near-shore water transport around the islands and the aquacultural sites. The resolution in this example is down to 15 meters. The 3D grid can contain millions of triangles which each hold several parameters, including speed, salinity and temperature at different depths.
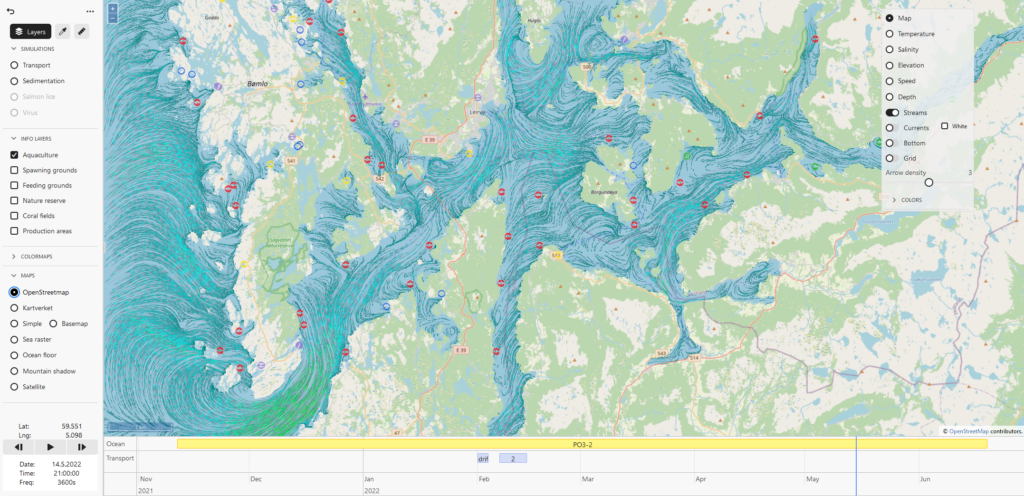
Current streams
This video is a capture from the dashboard showing the surface streams/currents in the area on August 15th, 2022. The blue color represents slow transport, while green and yellow mean faster moving currents. Red represents the fastest transport. The current streams give a unique insight into how currents move at a particular time.
35 depth layers
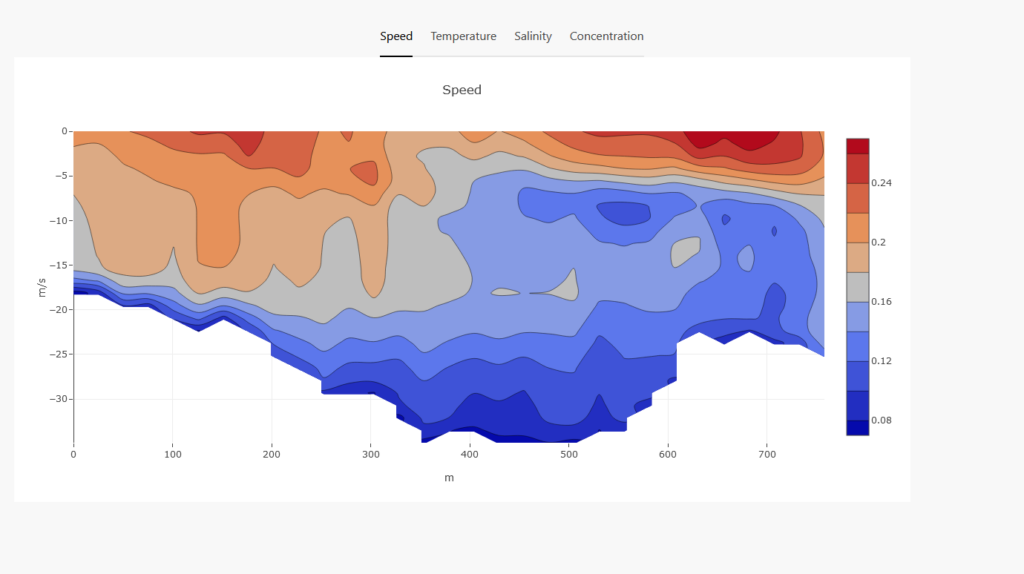
This image shows a plot of the ocean profiles 35 layers from the surface to the bottom like a curtain stretched through the aquacultural site. The different colors represents the velocity of the currents in m/s at different depths. When analyzing particle transports the concentration tab is useful to investigate at which depth the particles are traveling.

Example: Ocean salinity
This animation shows the salinity level in the Troms region during 10 days of May 2022. Warmer temperatures and ice melting resulted in the Målselv river pushing a lot of fresh water into the fjords. The blue color represents water with lower salinity, while yellow represents higher salinity levels.
Example: Sedimentation
Oceanbox.io is offering customized high-resolution grids in areas of special interest. In this example, sedimentation over time from an aquaculture installation is examined in detail through simulation.
For more information please contact us at info@oceanbox.io.